
Stonkholders,
This filing was not on the schedule.
StonkFun's first-party revenue ledger was showing $574,534 of recognized platform revenue for Sunday, 6 September, with the UTC day still underway.
The same ledger showed $344,661 used to buy STONK, 3.41 million STONK purchased and 3.44 million burned, against cumulative buyback expenditure of $1,367,318 at the screenshot.
Two days earlier, StonkFun had reported a daily record of $78,869.
The accounting basis is the same. Sunday is already 7.3 times the September 4 record.
That is enough reason to reopen the spreadsheet.
The scenarios we wrote down in August
Brief 009 was published on August 21 after StonkFun went through its first meaningful revenue drawdown.
At the time, trailing-seven-day revenue was $269,542. We annualized that observation to roughly $14 million and retained a scenario table rather than pretending a few weeks of history constituted a forecast.
One of the upside cases in that table assumed $496,784 of weekly revenue.
It was deliberately ambitious relative to the operating base then visible.
One incomplete Sunday has now exceeded it.
Exhibit A · The old scenarios have been passed
| Observation | Basis | Revenue | Sunday vs. |
|---|---|---|---|
| Brief 009 · observed trailing revenue | per seven days | $269,542 | 2.13× |
| Brief 009 · first weekly upside scenario | per seven days | $496,784 | 1.16× |
| 4 September · daily platform-revenue record | per day | $78,869 | 7.3× |
| 6 September · Sunday observed, intraday | per day | $574,534 | — |
Brief 009 rows are weekly observations retained from 21 August 2026; the September rows are single UTC days of StonkFun first-party recognized platform revenue, and 6 September is an intraday observation. The final column divides Sunday's $574,534 by each row; the first two ratios compare one day with a full week.
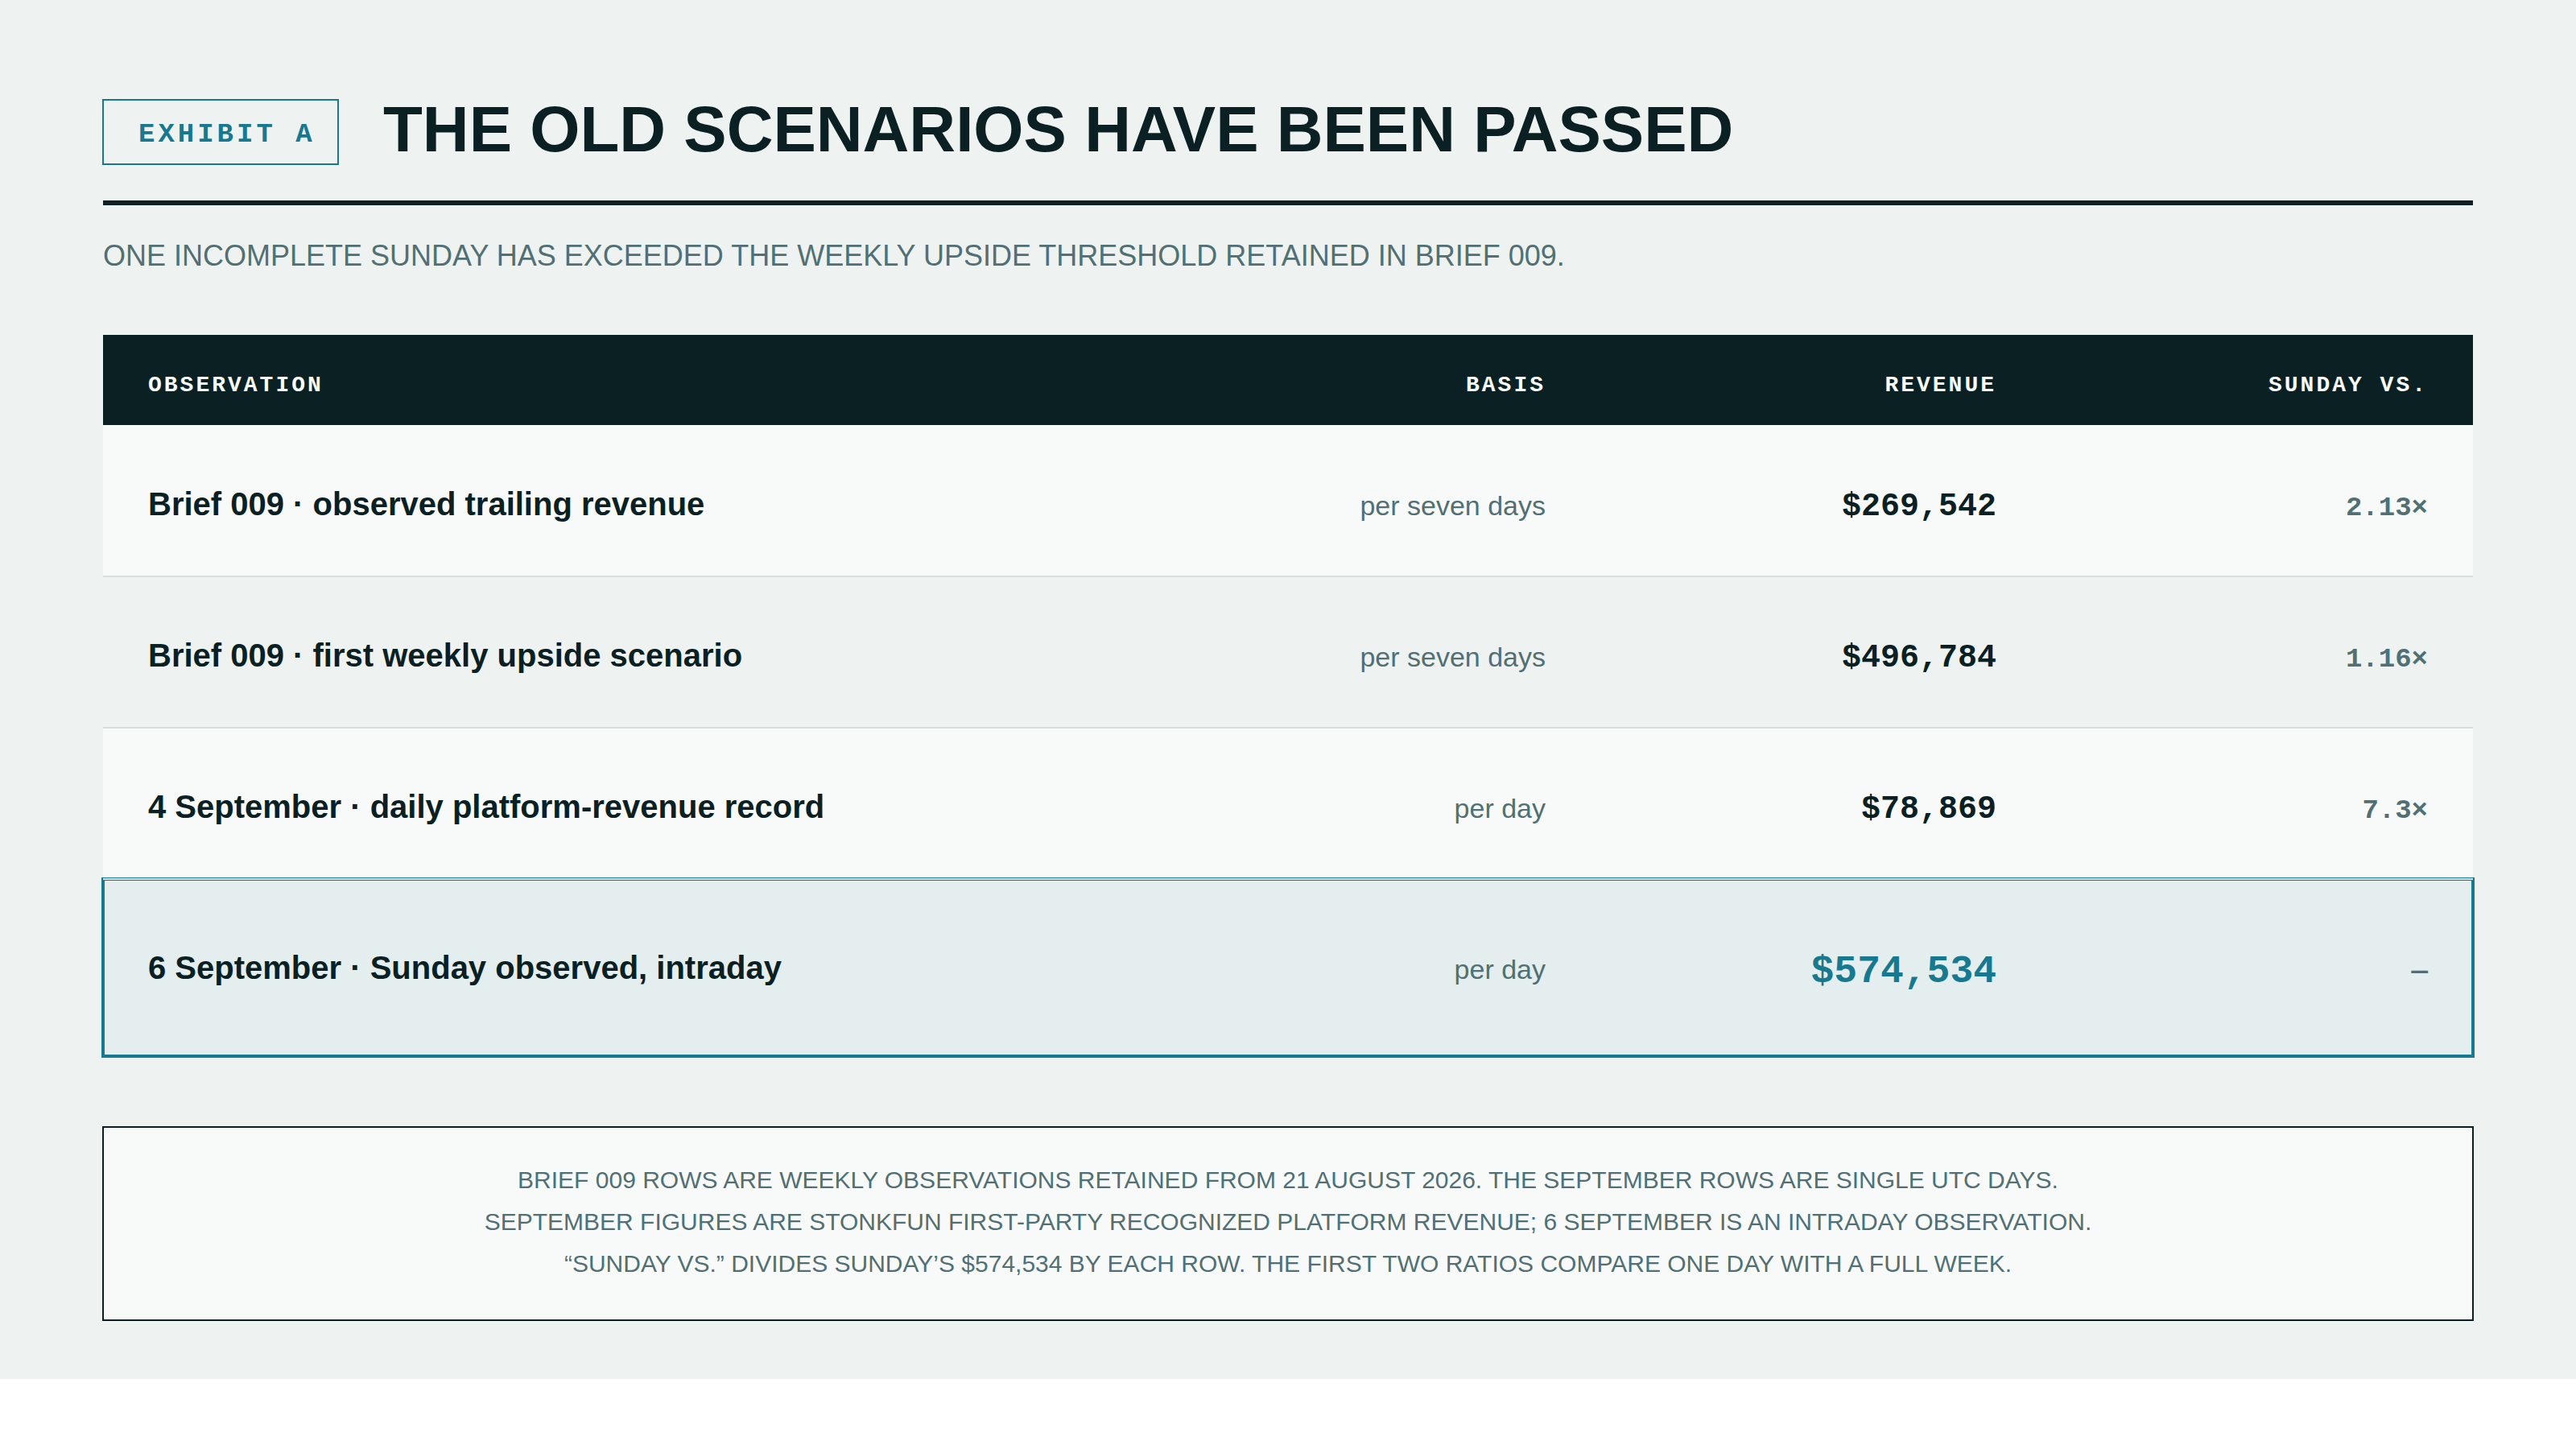
Sunday's $574,534 is more than twice the entire seven-day revenue observed in Brief 009 and roughly 16% above the first weekly upside scenario we retained on the page.
That does not mean $574,534 should now be multiplied indefinitely into the future.
It means the boundaries of the old scenario analysis no longer describe the business we are observing.
The comparison improved with Brief 011
Brief 011 introduced PONS because it was a better operating reference than Pump.
Pump demonstrated what a launch ecosystem could become at scale, but it was already so large that most comparisons were abstract. PONS gave us something closer: a rapidly scaling launch-and-trading system generating meaningful protocol revenue and routing value back toward its token.
At the August 30 cutoff, PONS had approximately $2.06 million of seven-day protocol revenue against $184,439 for StonkFun.
The gap was about 11 times.
It was the central fact in the analysis.
PONS remains ahead on its recent revenue run-rate, but the comparison looks different six days later.
Its current trailing-30-day revenue equates to approximately $358,000 per day. Its much stronger trailing-seven-day period equates to roughly $1.01 million per day.
Sunday's StonkFun observation has already moved above the first of those levels.
The recent PONS seven-day rate remains a meaningful step higher.
That gives us a more useful operating range than simply saying one protocol is larger than another.
Pump belongs back in the analysis
Brief 009 originally used Pump as the obvious Solana launchpad benchmark.
It remains useful for exactly that reason.
Looking only at pump.fun, its recent trailing-30-day protocol revenue equates to roughly $1.21 million per day.
The broader combined Pump entity is closer to $1.9 million per day on the same trailing-30-day basis.
StonkFun is not operating at those levels.
But $574,534 is no longer trivial beside them.
Sunday's current observation is roughly 47% of pump.fun's trailing-30-day average daily protocol revenue.
That is a more useful comparison than the one available to us in August.
Hyperliquid is a different comparison
Hyperliquid is not a launchpad and should not be treated as one.
It belongs in this analysis because its economics show what mature protocol value capture can look like.
Hyperliquid is currently generating roughly $1.85 million per day when its trailing-30-day protocol revenue is expressed as a daily average. Its token economics route an unusually high share of the relevant protocol revenue toward HYPE purchases through the Assistance Fund.
StonkFun currently directs approximately 60% of recognized platform revenue toward STONK buybacks and burns.
The businesses are different enough that using Hyperliquid as a direct valuation peer would be misleading.
It is still useful context for the longer-term question: what happens when substantial protocol revenue is paired with substantial native-token capture?
A new operating range
The revenue scenarios now need to begin with the number on the screen rather than the numbers we wrote in August.
Exhibit B · Operating scenario ladder
| Scenario | Daily revenue | Annualized revenue | Annualized buybacks at 60% |
|---|---|---|---|
| 50% normalization from Sunday | $287k | $104.9m | $62.9m |
| Sunday observed | $574.5k | $209.7m | $125.8m |
| Continued growth / $1m per day | $1.00m | $365.0m | $219.0m |
| PONS current 7d scale | ~$1.01m | ~$370.2m | ~$222.1m |
| pump.fun current 30d scale | ~$1.21m | ~$441.8m | ~$265.1m |
Mechanical annualization. Scenario analysis, not forecasts. Two larger systems are carried alongside the ladder as observed scale references rather than scenarios: Hyperliquid at approximately $1.85m per day and $674m annualized on a trailing-30-day basis, and the combined Pump entity at approximately $1.91m per day and $698.5m annualized on the same basis.
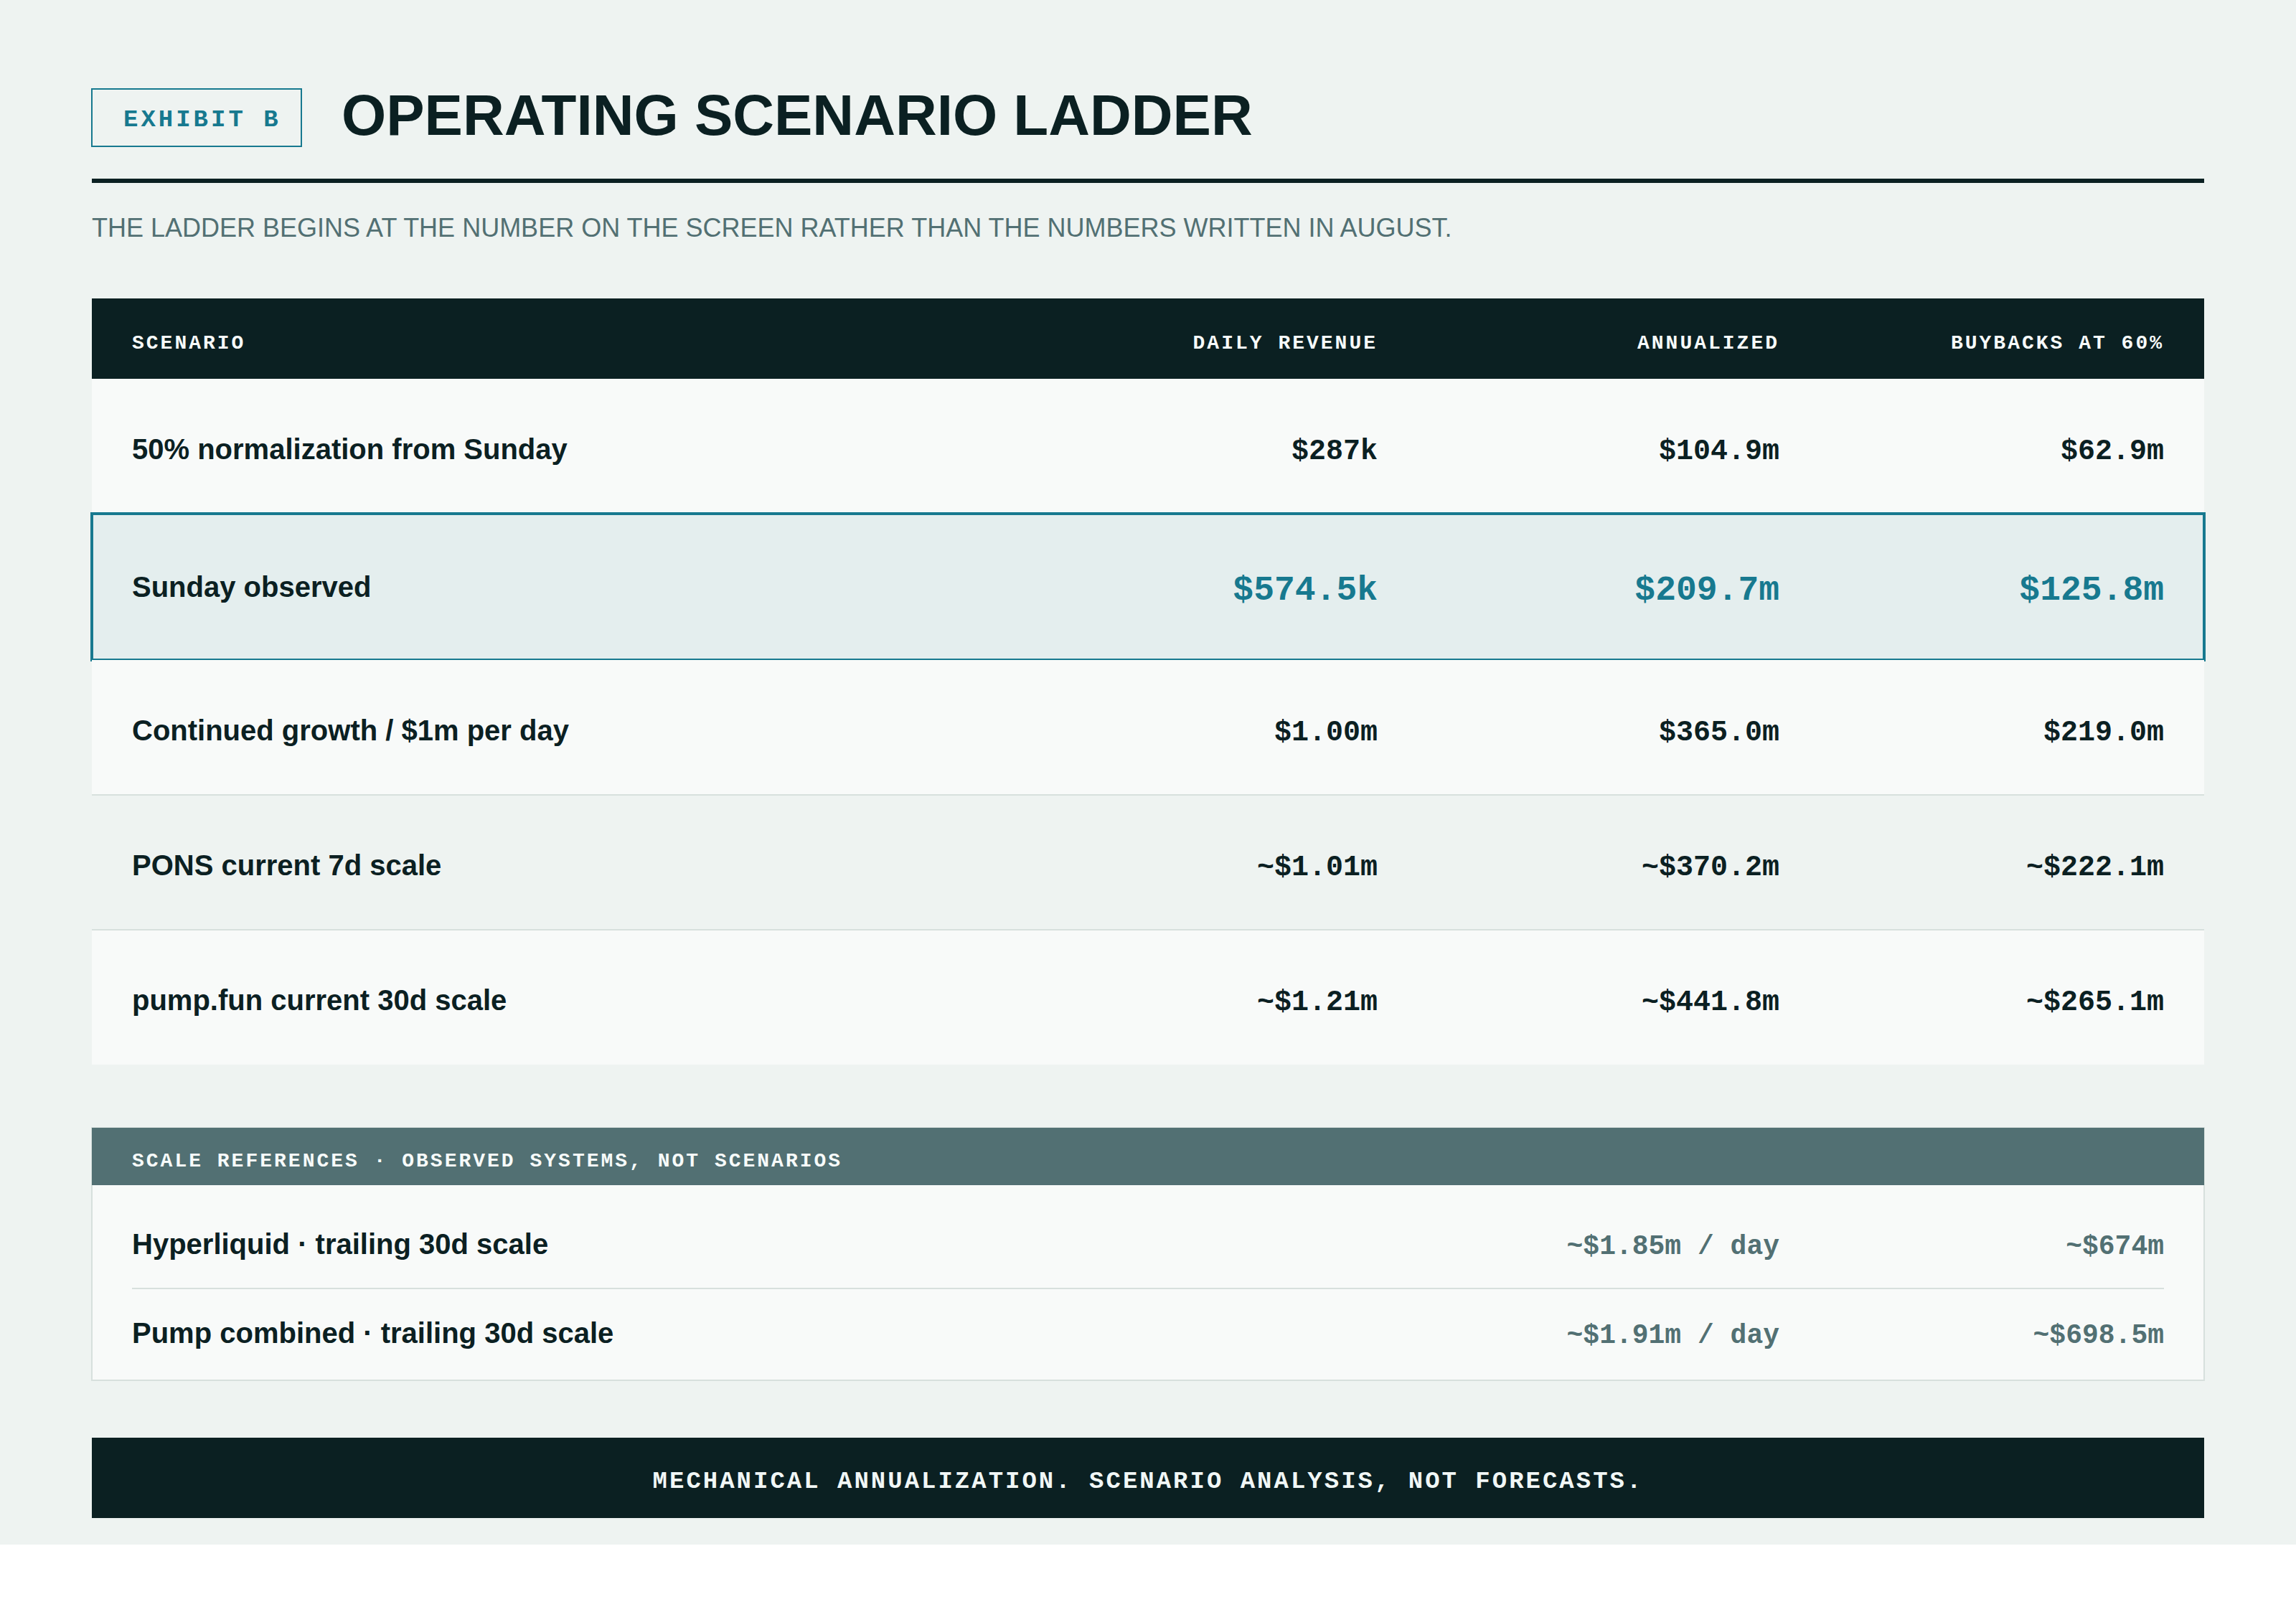
The first row assumes Sunday revenue falls by half.
Even that produces more than $100 million of annualized platform revenue.
The second row does nothing more complicated than multiply Sunday's current observation by 365:
$574,534 per day becomes approximately $209.7 million per year.
At a 60% buyback allocation, the corresponding annualized STONK purchases would be approximately $125.8 million.
Again, this is arithmetic rather than guidance.
Sunday may be exceptional. Revenue can fall. Claim timing can make individual days uneven.
The table is useful because it tells us what persistence would mean.
The next obvious operating landmark is approximately $1 million per day.
That is also roughly where PONS has been operating on its stronger recent seven-day window.
What is the market currently paying for revenue?
There is no need to invent a valuation multiple.
Pump and PONS already give us two observable references.
Using annualized trailing-30-day protocol revenue:
- the combined Pump entity trades at approximately 2.38 times revenue;
- PONS trades at approximately 4.71 times revenue.
An equal-weight average of the two is approximately 3.54 times annualized revenue.
Hyperliquid is intentionally excluded from that average. Its business, maturity and current valuation are sufficiently different that including it would overwhelm rather than improve the comparison.
STONK currently looks very different.
At approximately $141 million of market capitalization and Sunday's $574,534 mechanically annualized to approximately $209.7 million, STONK is trading at roughly:
0.67 times Sunday's annualized revenue rate.
Exhibit C · Peer revenue multiples
| System | Annualized revenue | Market capitalization | MCap / revenue |
|---|---|---|---|
| STONK · Sunday recognized platform revenue, annualized | ~$209.7m | ~$141m | ~0.67× |
| Pump combined · annualized trailing-30d protocol revenue | ~$698.5m | ~$1.66bn | ~2.38× |
| PONS · annualized trailing-30d protocol revenue | ~$130.5m | ~$615m | ~4.71× |
| Equal-weight Pump / PONS average | — | — | ~3.54× |
STONK's denominator is first-party StonkFun recognized platform revenue; the peer denominators are external protocol-revenue observations, and the two are not interchangeable. Peer market capitalizations are external snapshots. Hyperliquid, at approximately $674m of annualized trailing-30-day revenue, is excluded from the average.
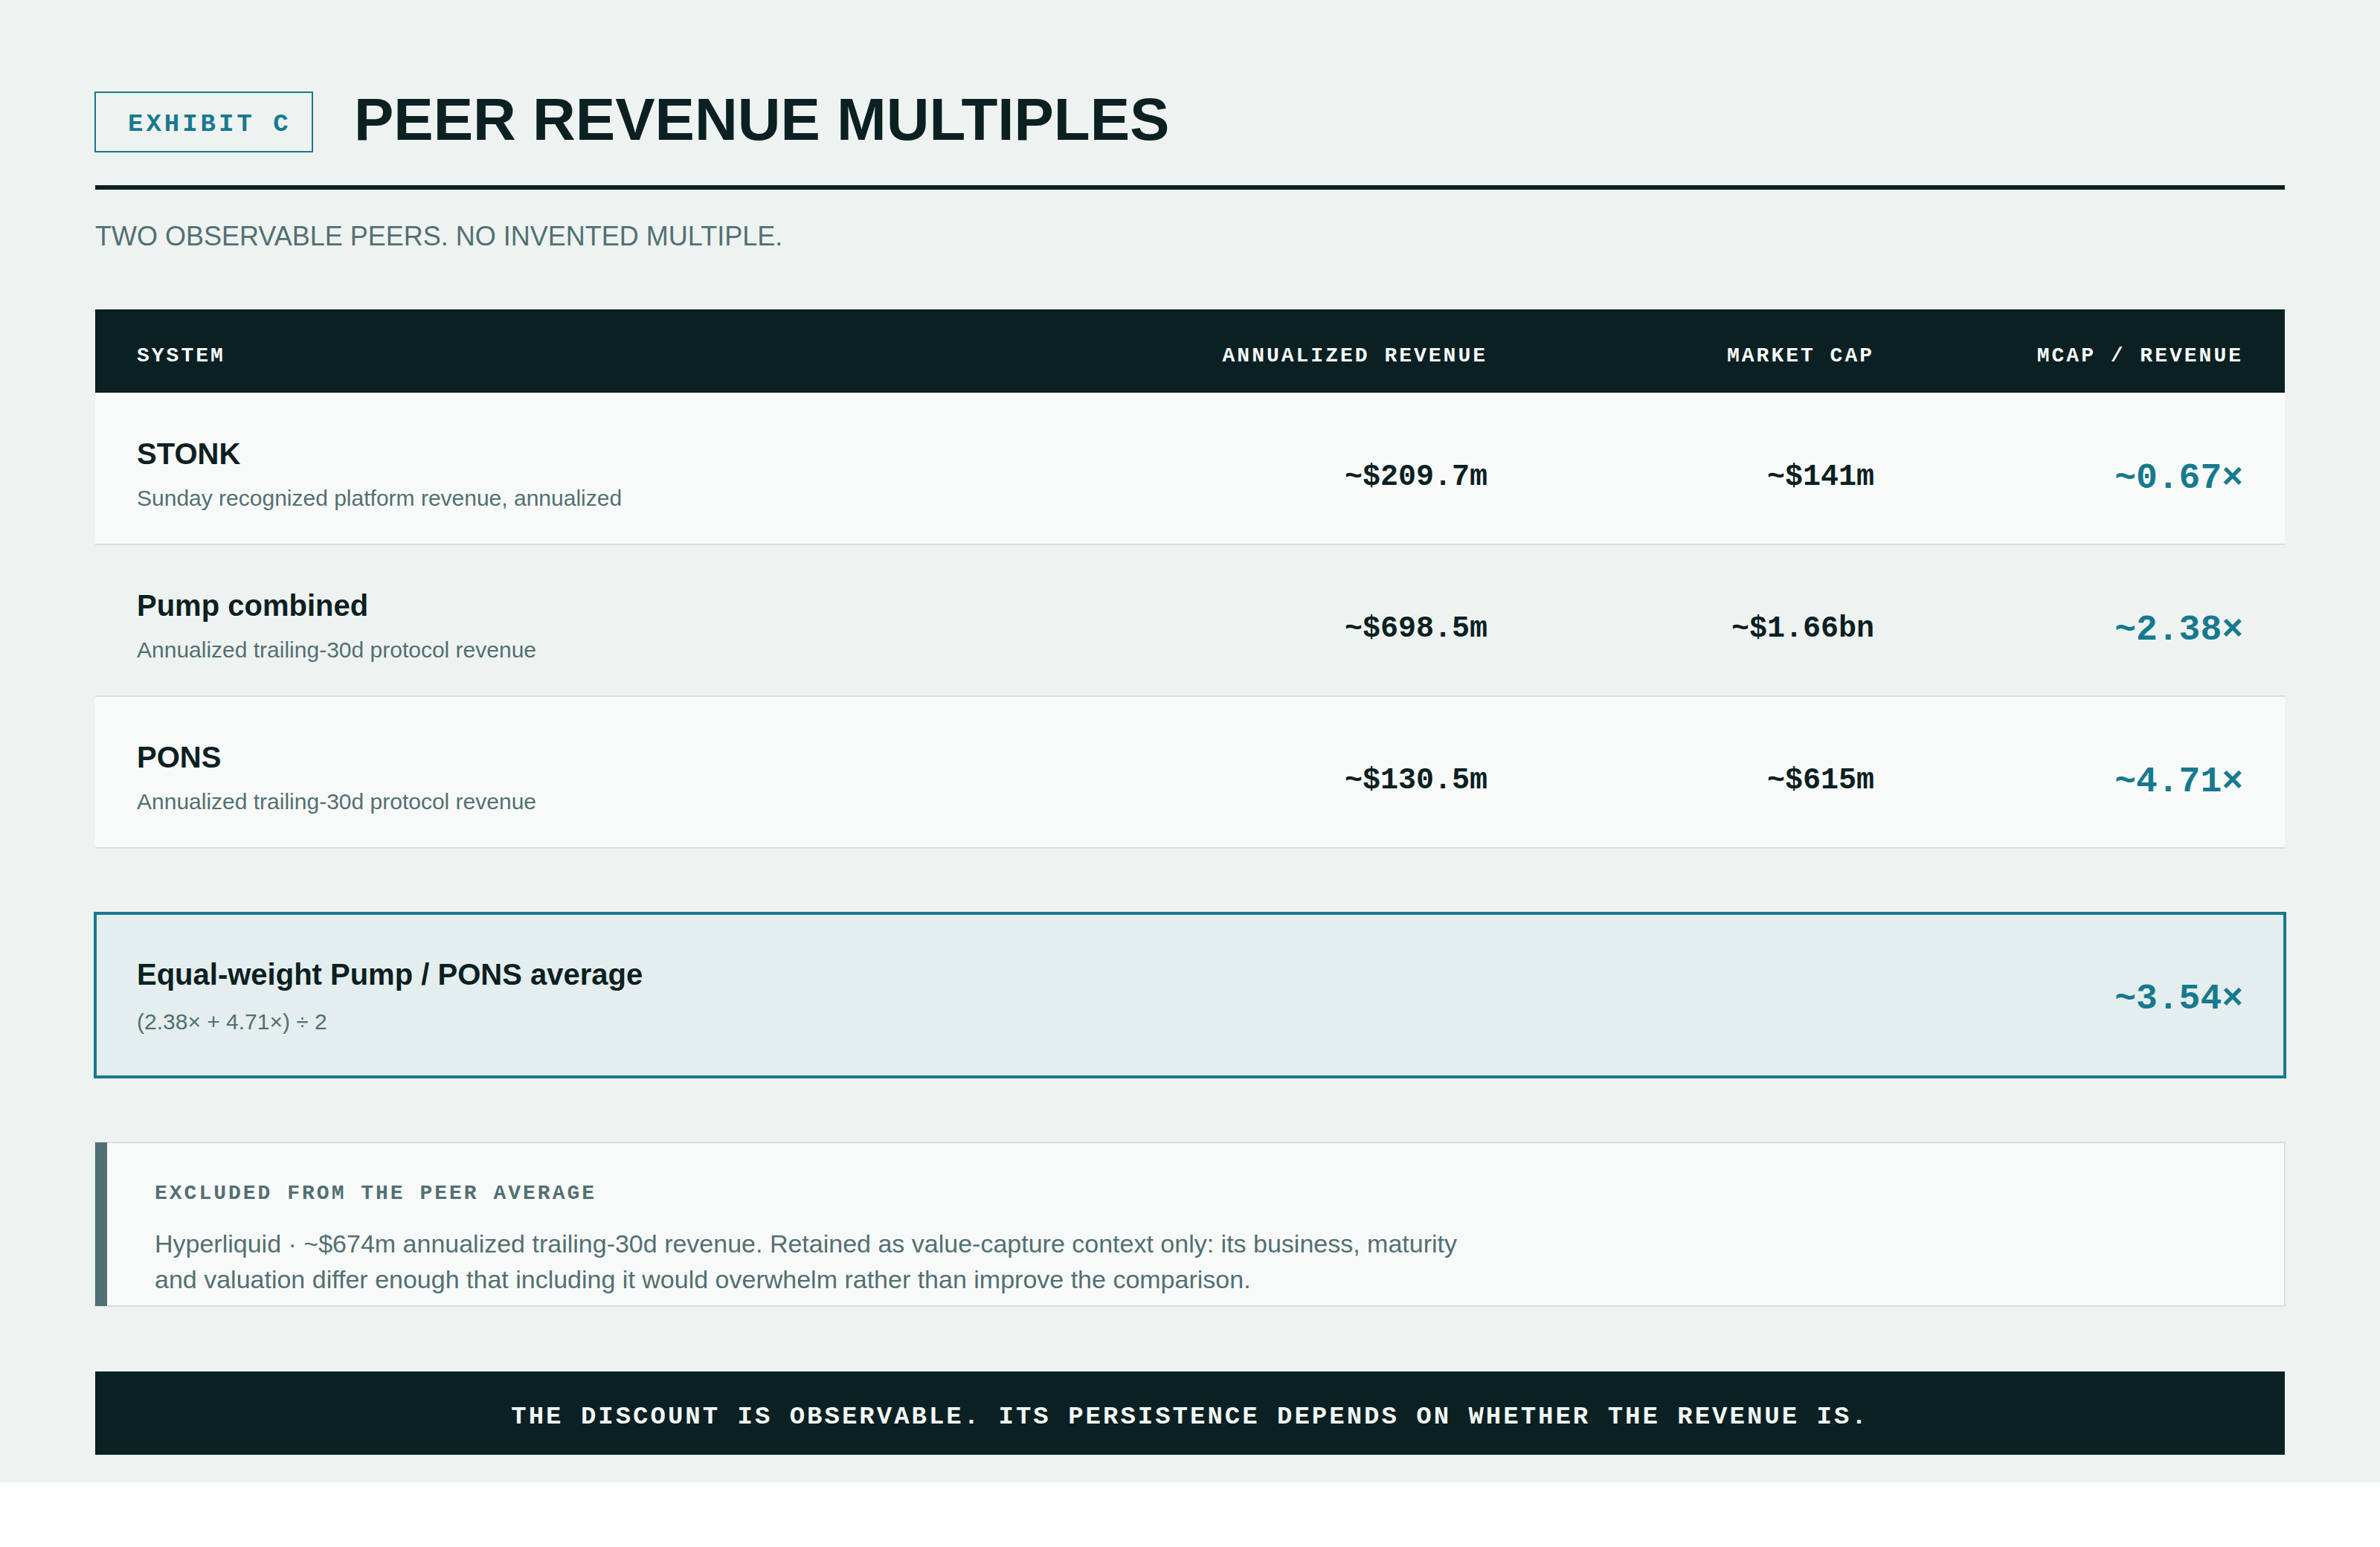
The discount is obvious.
There is also an obvious reason for it.
Pump and PONS are being valued against longer observed revenue histories. The denominator being used for STONK here is one unusually strong, still-incomplete Sunday.
The market does not have to assume that Sunday's revenue persists.
Neither do we.
That is why the multiple comparison becomes more useful with time.
What would peer valuation look like if the revenue persisted?
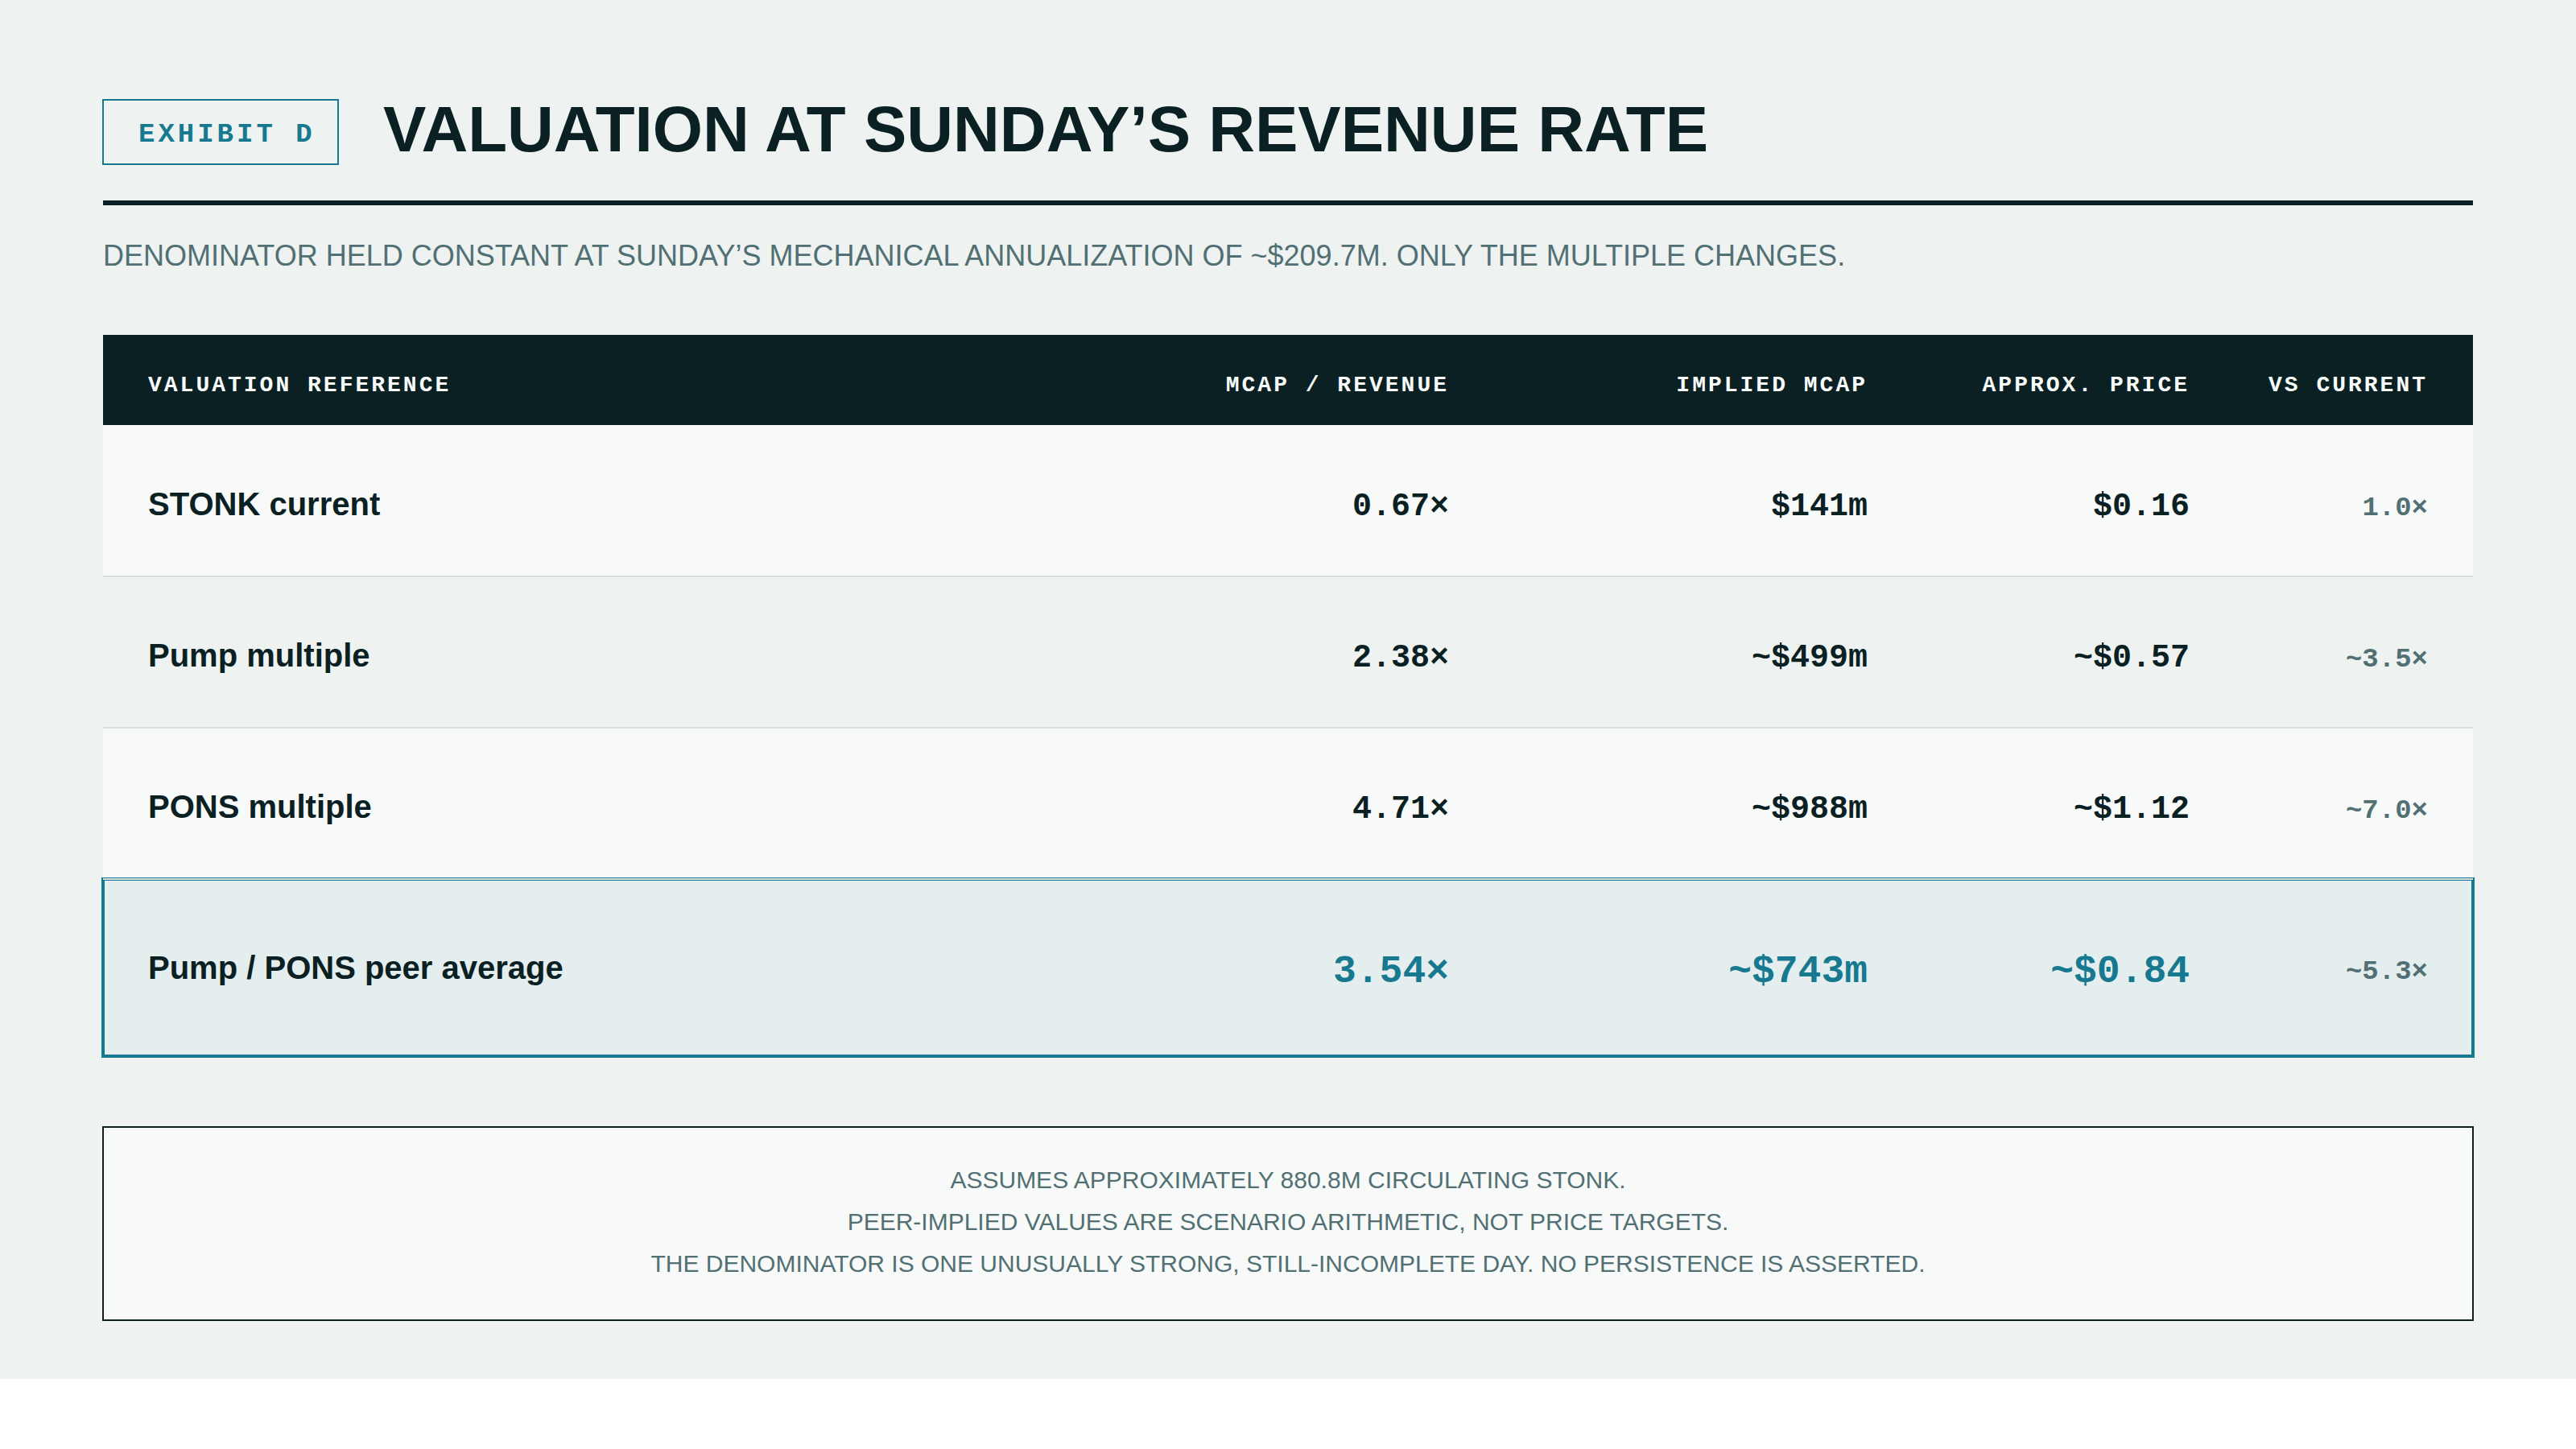
Holding Sunday's $209.7 million mechanical annualization constant produces the following arithmetic:
Exhibit D · Valuation at Sunday's revenue rate
| Valuation reference | MCap / annualized revenue | Implied STONK mcap | Approx. STONK price | vs current |
|---|---|---|---|---|
| STONK current | 0.67× | $141m | $0.16 | 1.0× |
| Pump multiple | 2.38× | ~$499m | ~$0.57 | ~3.5× |
| PONS multiple | 4.71× | ~$988m | ~$1.12 | ~7.0× |
| Pump / PONS peer average | 3.54× | ~$743m | ~$0.84 | ~5.3× |
Assumes approximately 880.8 million circulating STONK. These are scenario calculations, not price targets, and no convergence with any peer valuation is asserted.
The central case in that table is not an invented five-times multiple.
It is the equal-weight average of two observable peer multiples.
At Sunday's revenue rate, applying that peer average produces an implied market capitalization of approximately $743 million.
That is roughly 5.3 times the current market capitalization and approximately $0.84 per STONK at the current circulating-supply assumption.
None of this establishes that STONK is worth $743 million today.
For that conclusion to become more defensible, two things would have to happen.
First, the revenue denominator would need to persist long enough to stop being a one-day observation.
Second, the valuation discount to comparable revenue-producing systems would need to narrow.
The first can be measured.
The second is up to the market.
LaunchLab starts here
It would be convenient to credit the weekend's revenue acceleration to LaunchLab.
We do not have the evidence to do that.
StonkFun publicly announced the LaunchLab production migration during September 5 and stated that new deployments would thereafter use Raydium LaunchLab.
September 4's $78,869 therefore predates the public cutover.
Sunday occurs after it.
That still does not make $574,534 "LaunchLab revenue."
Existing StonkFun pools continue to trade. Platform fees are recognized when claimed. Without pool-level reconciliation, revenue generated by the previous architecture and revenue attributable to newly launched LaunchLab pools cannot yet be cleanly separated.
For this Brief, the $574,534 figure is therefore what the ledger says it is:
Sunday recognized StonkFun platform revenue.
LaunchLab matters principally because it changes the next set of observations.
Deployment is cheaper and permissionless. We can measure how many launches occur, how many graduate, how much trading persists, revenue per launch and ultimately how much platform revenue belongs to the new architecture.
The launch observer we have already built should be promoted once the current rewards deployment is complete.
Then we can stop inferring.
What matters from here
The most interesting question is no longer whether StonkFun can produce a strong revenue day.
It has.
The question is what remains after the day rolls off the chart.
A 50% normalization from Sunday's current number would still imply more than $100 million of annualized platform revenue.
Persistence around the current level would put the arithmetic above $200 million.
Approximately $1 million per day would place StonkFun around the recent seven-day operating scale of PONS.
Beyond that sit the revenue levels currently demonstrated by pump.fun, the broader Pump ecosystem and Hyperliquid.
Those levels are not forecasts.
They are useful because they already exist.
Brief 009 gave us a scenario framework when the history was short.
Brief 011 gave us a better operating comparable.
Sunday has given us a new denominator.
Management has updated the spreadsheet accordingly.
Methodology note
Unless otherwise stated, StonkFun revenue in this Brief refers to the platform's first-party recognized daily platform-revenue accounting. Individual daily observations may reflect fee-claim timing and should not be interpreted as a perfect reconstruction of economic accrual during that UTC day.
Peer protocol revenue and market-cap observations are external third-party data and are kept separate from StonkFun's first-party figures throughout. No first-party StonkFun number in this Brief has been substituted with an external estimate.
Two annualization bases appear in this Brief and are not interchangeable. StonkFun daily observations are annualized as the daily figure multiplied by 365. Peer figures are annualized from the unrounded trailing-period total reported by the source — trailing-30-day totals as total × 365 ÷ 30, and the PONS trailing-seven-day figure as total × 365 ÷ 7. Each peer daily figure shown here is therefore that annualization divided by 365, not a separately rounded daily value.
The Sunday September 6 number is an intraday observation and may increase before the UTC day closes.
All annualizations are mechanical arithmetic. All peer-implied market capitalizations and prices are scenarios, not forecasts or price targets.
LaunchLab revenue attribution has not been established at pool level and is not claimed in this Brief.
Sources
- Chairman's Brief 009 — The Denominator Has Been Tested ↗
- StonkFun — first-party revenue API ↗
- Chairman's Brief 011 — The Market Has Found a Comparable ↗
- DeFiLlama — Pons V1 protocol revenue ↗
- DeFiLlama — Pons V2 protocol revenue ↗
- DeFiLlama — pump.fun protocol revenue ↗
- DeFiLlama — Pump (combined entity) protocol revenue ↗
- DeFiLlama — Hyperliquid protocol revenue ↗
- DexScreener — STONK/SOL token-pairs endpoint ↗
- CoinGecko — STONK market data ↗
- CoinGecko — PONS market data ↗
- CoinGecko — Pump market data ↗
- StonkFun (X) — LaunchLab production migration ↗
- Raydium — LaunchLab documentation ↗
Stonks on Stonk is an independent editorial and meme project. This filing is commentary, not financial advice. Market data are volatile and all observations are timestamped snapshots. StonkFun revenue and buyback figures are first-party platform accounting; peer revenue and market-capitalization figures are external third-party observations. No STONK price target is implied, and no convergence with Pump, PONS or Hyperliquid valuations is asserted.