
Stonkholders,
Brief 007 ended with a simple observation: the denominator had done what it said it would do. It had not yet had the chance to be tested.
It has now been tested.
The platform experienced its first material retracement. A competing, attention-intensive launch entered the market around 17–18 August. Fees cooled from their strongest opening week. In the usual Solana accounting system, this would be considered an adequate basis for announcing the end of the company before lunch.
Management has instead reviewed the operating figures.
The figures can now be checked somewhere other than the pitch deck
StonkFun is now listed on DeFiLlama. The relevance is not the badge. The relevance is that protocol fees, protocol revenue, and $STONK buyback expenditure now have an independent adapter, a published methodology, and the same dashboard conventions used for the wider sector.
At the research cutoff, that adapter reported:
| Measure | Current observation |
|---|---|
| Revenue, trailing seven days | $269,542 |
| Revenue, trailing 24 hours | $25,691 |
| Cumulative tracked revenue | $834,684 |
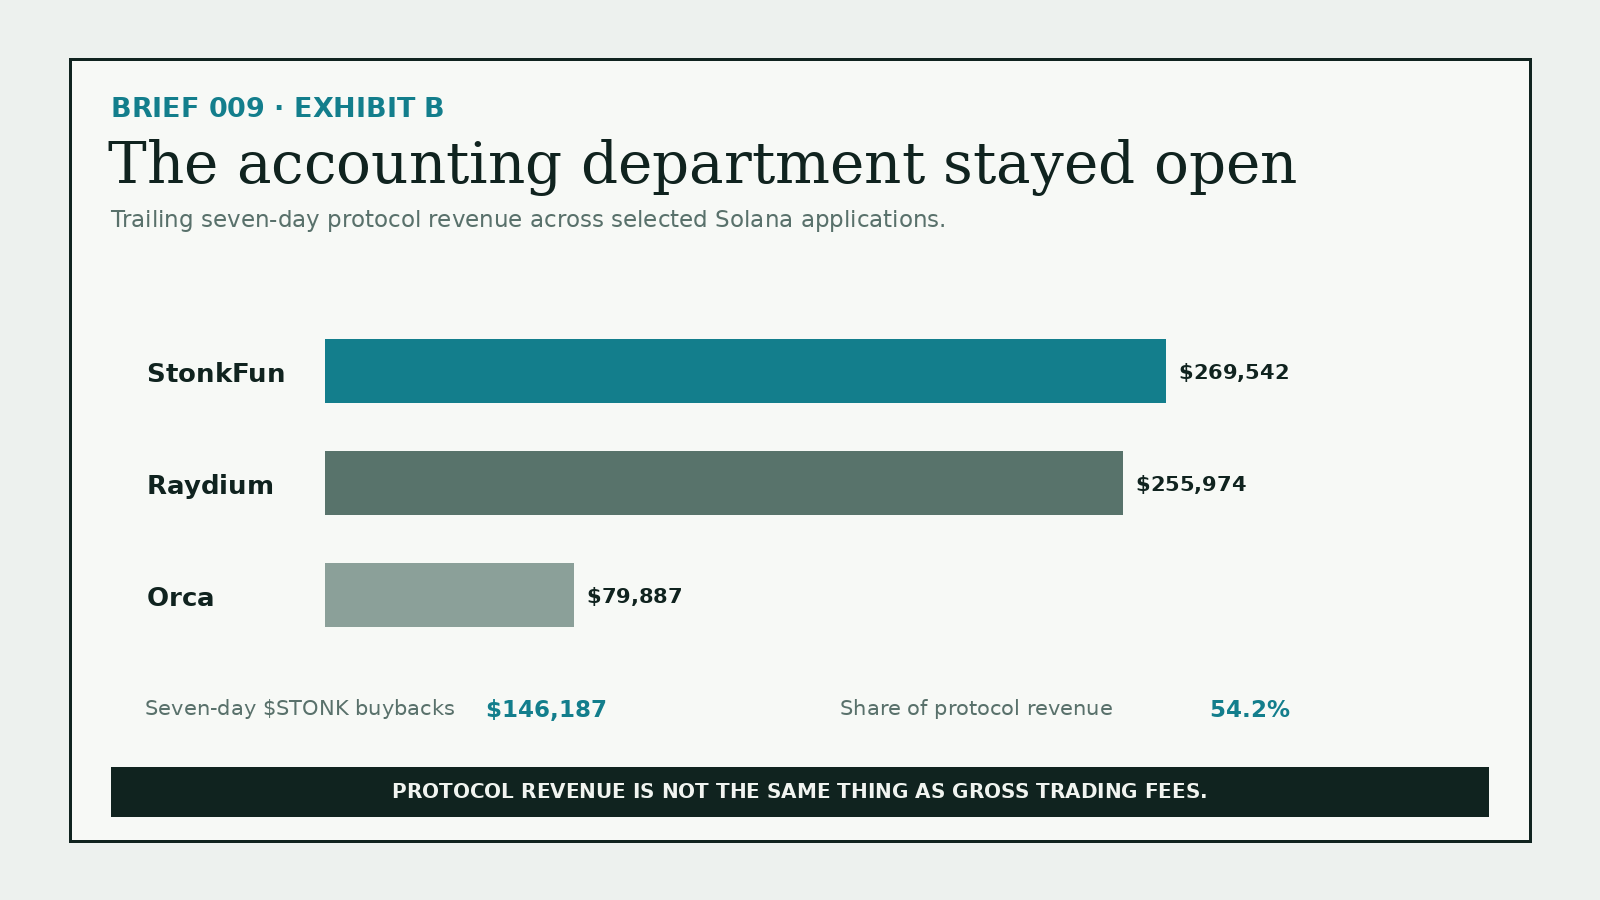
| $STONK buyback expenditure, trailing seven days | $146,187 |
| Cumulative $STONK buyback expenditure | $435,568 |
| Buyback share of trailing seven-day revenue | 54.2% |
| Revenue annualized directly from the trailing week | $14.05m |
| DeFiLlama's separately calculated annualized revenue | $11.72m |
DeFiLlama defines holder revenue here as quote assets spent buying $STONK through Jupiter. That is buyback expenditure. It is not a direct cash payment to token holders, and it should not be described as one.
There is a second accounting caveat worth retaining: the underlying positions sit on Raydium. DeFiLlama marks StonkFun's adapter as overlapping with other protocol accounting. StonkFun and Raydium are valid standalone observations, but adding their fees together would count shared economic activity twice.
Against actual seven-day protocol revenue, StonkFun's $269,542 compares with approximately $255,974 for Raydium and $79,887 for Orca. Gross swap fees tell a different story because the larger exchanges distribute substantial portions to liquidity providers. Protocol revenue is the relevant measure when the question is what the business itself captures.
The platform is 16th among 268 Solana entries with a reported seven-day revenue figure, and 32nd among 276 on the separate gross-fees measure. The distinction matters. An adapter ranking is not the same thing as a deduplicated ranking of independent businesses.
Brief 007 made projections. The subsequent week supplied an answer.
The original scenario table, reproduced without alteration:
| Original scenario | Weekly revenue | Annualized revenue | Annualized buyback-and-burn spend | Implied market cap at 0.52× | Implied market cap at then-current pump.fun 2.65× |
|---|---|---|---|---|---|
| Downside | $225,000 | $11,732,143 | $6,839,839 | $6,100,714 | $31,090,179 |
| Base: trailing two-week average | $300,000 | $15,642,857 | $9,119,786 | $8,134,286 | $41,453,571 |
| Upside: 5% of pump.fun's then-current fees | $496,784 | $25,903,737 | $15,101,879 | $13,469,943 | $68,644,903 |
| Upside: then-current DeFiLlama top-50 entry | $1,116,119 | $58,197,634 | $33,929,220 | $30,262,769 | $154,223,729 |
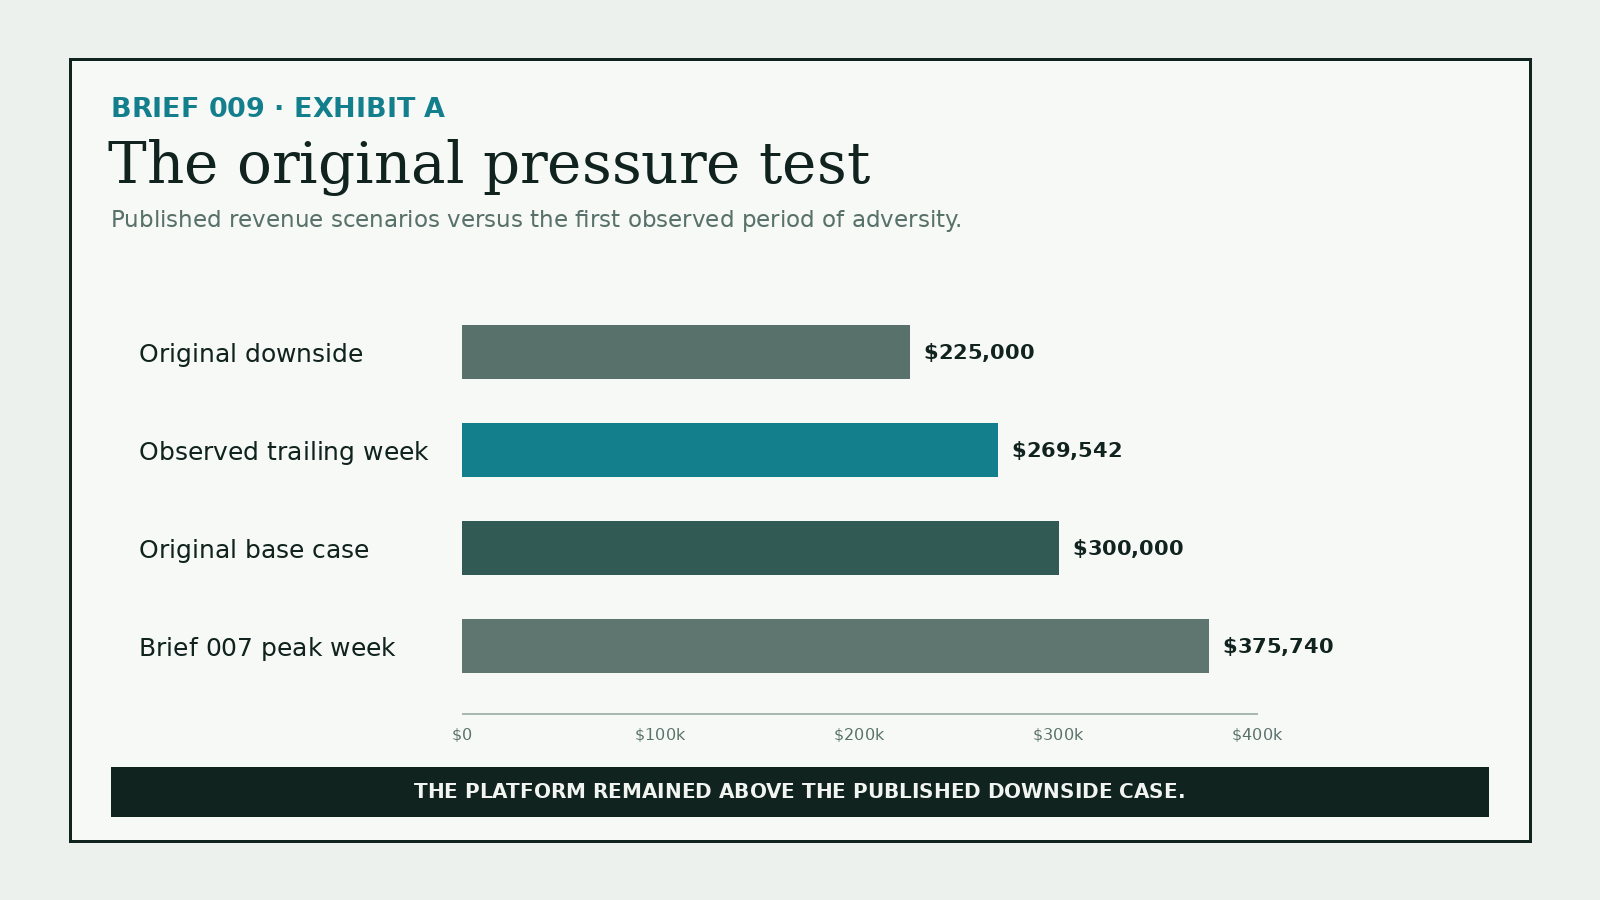
The current observed trailing week is $269,542.
That is $44,542 above the original downside scenario, or 19.8%. It is $30,458 below the original base case, or 10.2%. Compared with the $375,740 peak week used in Brief 007, revenue is lower by 28.3%.
All three statements can be true. The third one explains the headwind. The first two explain why management does not consider the headwind evidence of a broken operating model.
The original 0.52× methodology annualized the trailing seven days. Applying precisely that methodology today produces $14.05m in annualized revenue and a 0.49× market-cap-to-revenue multiple at the $6.90m token snapshot.
Using DeFiLlama's separately displayed $11.72m annualized figure produces 0.59× instead. Neither calculation is concealed. They answer slightly different questions because their annualization methods are different. The 0.49× figure is the apples-to-apples comparison with Brief 007.
The current market cap also remains between the original no-re-rating downside valuation of $6.10m and base valuation of $8.13m. Management is not claiming that the market consulted the spreadsheet. Management is noting that the spreadsheet has so far been more useful than the obituary.
Updating the scenarios without quietly changing the assumptions
For an updated sensitivity table, management uses the currently observed 54.2% buyback share, the current 0.49× seven-day-run-rate multiple, and Pump's approximately 2.47× multiple calculated on the same seven-day-run-rate basis. This is arithmetic under stated assumptions. It is not a valuation target, forecast, or expectation of convergence.
| Updated scenario | Weekly revenue | Annualized revenue | Annualized buyback expenditure at 54.2% | Implied market cap at current 0.49× | Illustrative market cap at Pump's 2.47× weekly-run-rate multiple |
|---|---|---|---|---|---|
| Original downside | $225,000 | $11,732,143 | $6,362,967 | $5,762,804 | $28,996,442 |
| Observed trailing week | $269,542 | $14,054,690 | $7,622,608 | $6,903,634 | $34,736,706 |
| Original base | $300,000 | $15,642,857 | $8,483,956 | $7,683,738 | $38,661,922 |
| Brief #007 peak week | $375,740 | $19,592,157 | $10,625,872 | $9,623,626 | $48,422,769 |
| Original first upside | $496,784 | $25,903,737 | $14,048,978 | $12,723,861 | $64,022,081 |
The two larger original upside cases have not been achieved. Their original thresholds are also historical conditions, not current targets: Pump's fee run-rate and the DeFiLlama top-50 entry point can both change. The first upside is retained as a sensitivity case only. No probability is assigned to any row.
The buyback share has also moderated from the roughly 58% observed in Brief 007 to 54.2% in the current trailing week. The mechanism remains active, but the difference should be recorded rather than explained away. The public data do not establish why the ratio changed.
The RWA desk remained open
The most useful measure of StonkFun's RWA relevance is what remains visible in the markets where the platform is actually active.
Across the 16 available underlying assets generating at least $10,000 of daily StonkFun-linked trading, the platform accounts for approximately 17.1% of observed same-asset market volume.
Across its six available PreStock assets, the figure is approximately 35.2%.
In several individual stock-linked markets, the platform remains responsible for a majority of observed trading.
| Quote asset | StonkFun-linked 24h volume | Same-asset market volume | StonkFun share |
|---|---|---|---|
| MCDX | $11,768 | $16,036 | 73.4% |
| TTWO | $81,207 | $116,634 | 69.6% |
| LLY | $52,457 | $83,164 | 63.1% |
| APPLX | $101,464 | $193,639 | 52.4% |
| ANDURIL | $10,507 | $27,312 | 38.5% |
| OPENAI | $131,516 | $363,480 | 36.2% |
| ANTHROPIC | $273,355 | $787,806 | 34.7% |
| AMZNX | $28,483 | $99,351 | 28.7% |
| SPYX | $451,795 | $2,354,983 | 19.2% |
Those observations describe continued participation in identifiable markets rather than an assumption that every available pairing attracts equivalent demand.
The active-market measure uses an explicit $10,000 daily threshold. The PreStock figure uses the six assets currently available in that category. Neither figure should be described as the share of every RWA-linked asset on Solana.
For completeness, management also reviewed the broader available-asset universe:
| Scope | Available assets | StonkFun-linked 24h volume | Same-asset market volume | StonkFun share |
|---|---|---|---|---|
| Active StonkFun markets: at least $10,000 of daily activity | 16 | $1,611,700 | $9,436,575 | 17.1% |
| PreStock quote assets only | 6 | $417,008 | $1,185,064 | 35.2% |
| All currently available RWA quote assets, all tracked venues | 40 | $1,646,634 | $31,163,724 | 5.3% |
| Same available assets, Raydium-related denominator | 40 | $1,646,634 | $21,655,056 | 7.6% |
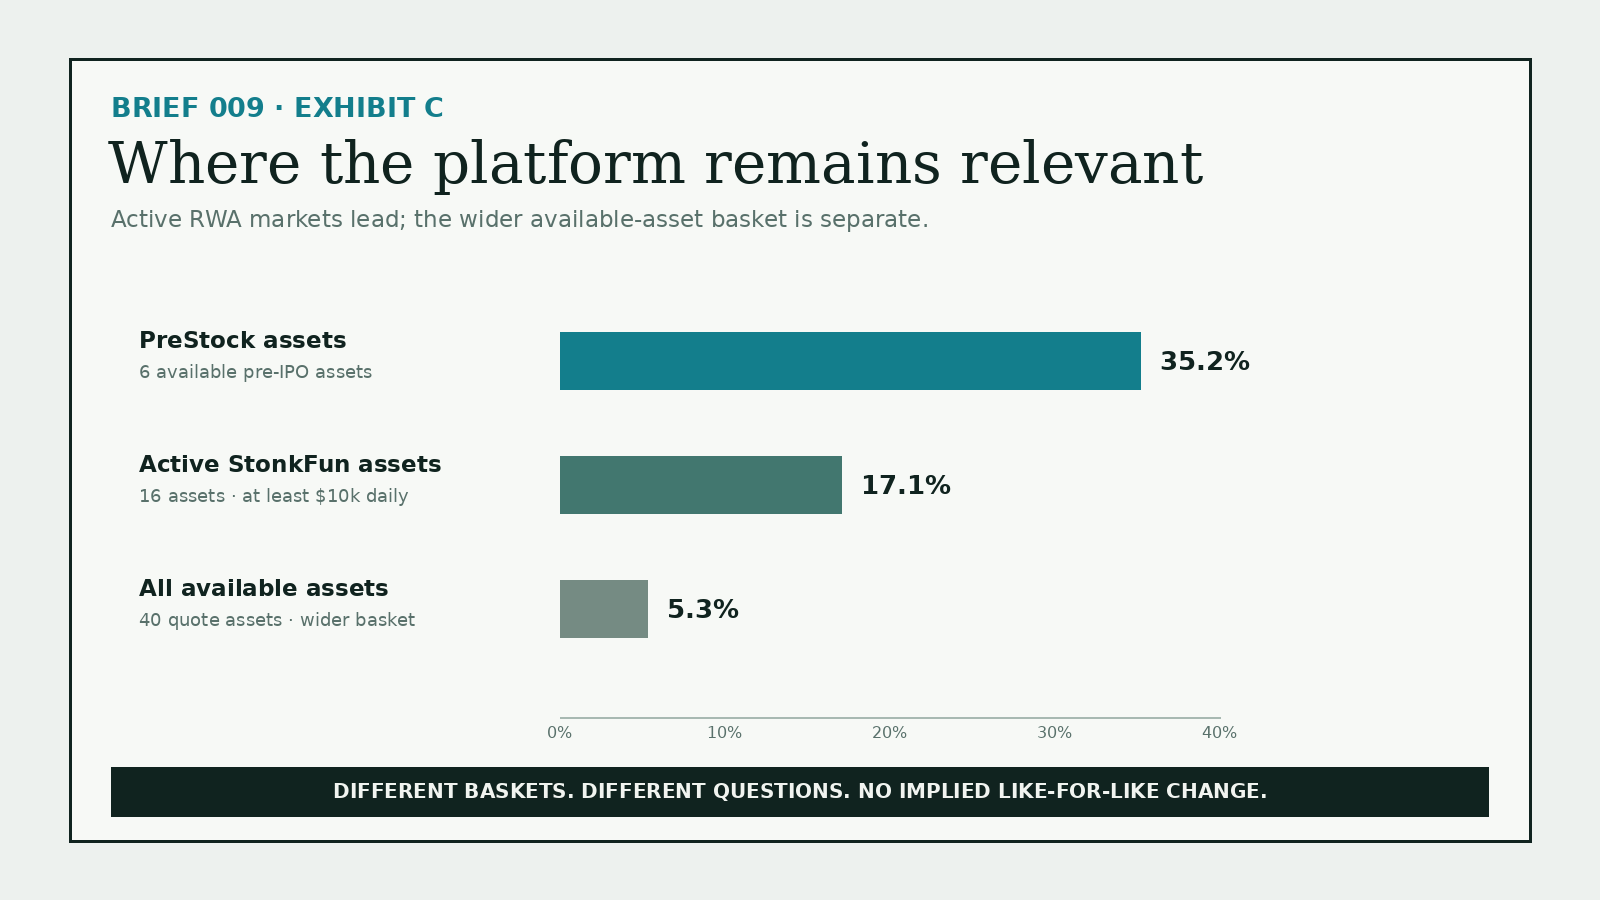
The 5.3% full-basket figure is a valid description of the 40 assets available at the current snapshot.
It is not a verified like-for-like update to Brief 007's 35.6%.
The earlier filing examined 36 available assets, but its complete historical constituent list was not preserved. The current universe contains 40 assets, and trading outside StonkFun has changed substantially. Without reconstructing the original mint-by-mint basket, management cannot isolate how much of the difference reflects platform share, newly included assets, or activity elsewhere.
One example makes the denominator problem unusually clear.
Brief 007 explicitly identified CRCLX as an existing StonkFun pairing with limited platform activity. CRCLX therefore cannot be dismissed as a newly added asset. At the latest snapshot, however, that single asset generated approximately $8.61 million of wider-market trading while contributing approximately $33 through StonkFun.
Its current external market volume is larger than the entire $7.38 million denominator used across all 36 assets in the earlier filing.
SKHY and MU add approximately $6.98 million of wider-market trading against approximately $4 of StonkFun activity. Their inclusion in the original 36-asset basket cannot be confirmed from the published record.
Excluding SKHY and MU, while retaining the historically confirmed CRCLX pairing, produces approximately 6.8% across 38 current assets. This is a sensitivity check, not a reconstructed historical comparison: two further differences between the current and original baskets remain unidentified.
The defensible conclusion is therefore more precise than either a celebratory headline or an obituary.
The platform remains a material participant where its RWA-linked launches are active. Its PreStock position remains substantial. Several individual stock-linked markets still rely on StonkFun for a majority of observed trading. The broader available-asset basket captures much larger external markets and should be presented separately.
Separately, cumulative StonkFun-attributed RWA-linked volume increased from approximately $86.90m in Brief 007 to $106.37m: an increase of approximately $19.47m, or 22.4%. Total cumulative platform-attributed volume rose from $220.30m to $296.20m.
That cumulative dataset was last updated 2026-08-21T04:06:42.618Z and records 1,261 unpriced pool-days. It establishes continued accumulation, not an exact current run rate. StonkFun-linked 24-hour volume in the current available-asset basket is below the earlier reported platform-volume snapshot, but a fixed-constituent market-share comparison cannot be verified.
The market-share calculation enumerates StonkFun pools from its public token API, groups them by the quote-asset mint, and adds external Solana pools returned by DexScreener after removing matching StonkFun pool addresses. DexScreener can cap the number of returned pools per token; outside activity may therefore be understated. Different data-provider clocks can also cause brief discrepancies. The percentages are estimates, not audited market shares.
What the market appears to have noticed
At the token snapshot, $STONK carried a market capitalization of $6,903,634 and was up 58.3% over the preceding 24 hours.
The first drawdown was real. So was the subsequent rebound. The second fact does not erase the first, but it suggests that the market did not regard the first available lower valuation as the final word. Renewed interest in valuation is a plausible interpretation. It is not a verified explanation of trader intent.
On DeFiLlama's displayed annualized-revenue basis, the comparable valuation observations were approximately:
| Protocol | Market-cap snapshot | Displayed annualized protocol revenue | Market cap / displayed annualized revenue |
|---|---|---|---|
| StonkFun / $STONK | $6.90m | $11.72m | 0.59× |
| Pump / $PUMP | $1594.00m | $460.12m | 3.46× |
| Raydium / $RAY | $197.58m | $22.29m | 8.87× |
| Orca / $ORCA | $74.84m | $8.58m | 8.73× |
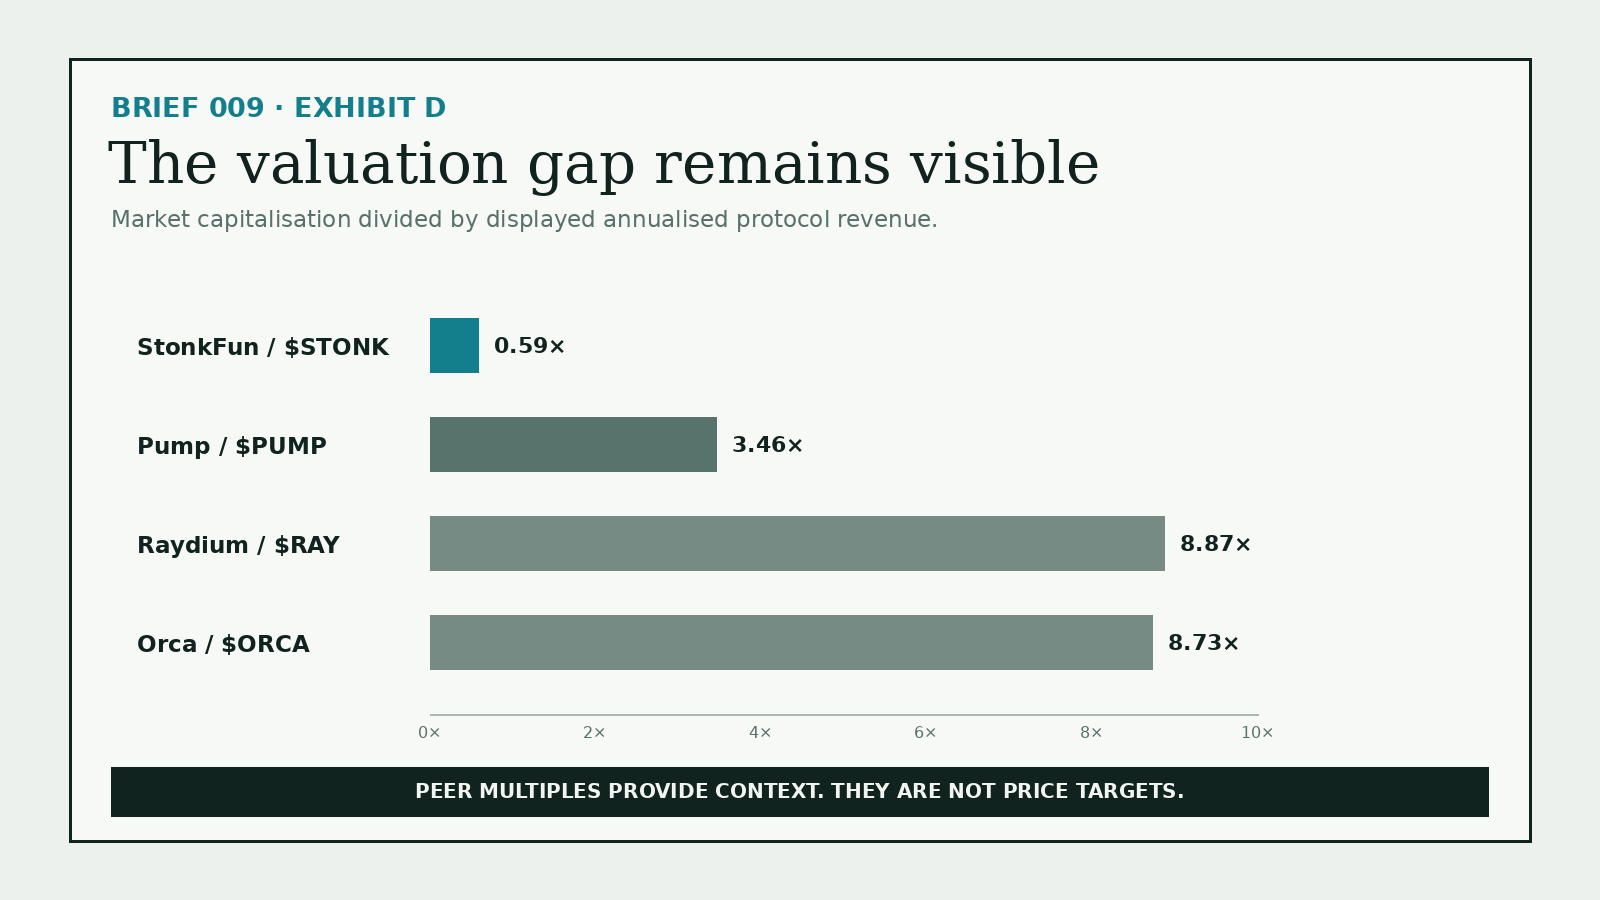
These protocols differ in age, liquidity, business mix, product scope, risk, and the relationship between protocol revenue and token economics. Their multiples are context, not a claim that $STONK deserves the same valuation or will receive it.
For $STONKS, the relevance remains the one established in Brief 007: $STONK is the platform token and the asset against which $STONKS is quoted. That creates exposure to the denominator. It does not confer protocol ownership, a promised distribution, official affiliation, or any guaranteed return.
The Chairman's view
The first version of this thesis had operating momentum and very little adversity. The updated version has less momentum, considerably more competition for attention, an actual retracement, independently tracked revenue, continuing buybacks, ongoing RWA activity, and a market that has shown some willingness to revisit lower valuations.
The strongest objection survives: revenue has declined from its peak, activity in some available RWA pairings remains limited, and a short-lived rebound can fail. Another week of weaker fees, shrinking buyback expenditure, or fading active-pair share would weaken the case further. Nothing in this filing prevents that outcome.
What the present numbers do establish is narrower, and more useful. The business has so far operated through the first set of headwinds above the downside revenue case that management had already put in writing. Its mechanism remains active. Its core RWA venues continue to matter. Its valuation remains low relative to selected peers under clearly disclosed methods.
The denominator has now been tested.
It has not requested assistance.
Sources
- Chairman’s Brief 007 — The Denominator Has Done What It Said It Would ↗
- DeFiLlama — StonkFun protocol dashboard and methodology ↗
- DeFiLlama — StonkFun seven-day protocol revenue ↗
- DeFiLlama — StonkFun $STONK buyback expenditure ↗
- DeFiLlama — Solana protocol-revenue ranking ↗
- StonkFun — available RWA quote assets ↗
- StonkFun — public token and pool data ↗
- StonkFun — cumulative RWA and total volume ↗
- DexScreener — Solana token-pairs endpoint ↗
- DeFiLlama — StonkFun adapter and overlapping Raydium classification ↗
- DeFiLlama — Pump protocol revenue and market capitalization ↗
- DeFiLlama — Raydium protocol revenue and market capitalization ↗
- DeFiLlama — Orca protocol revenue and market capitalization ↗
- Ansem — original launch announcement ↗
Stonks on Stonk is an independent editorial and meme project. This filing is commentary, not financial advice. Market data are volatile and all observations are timestamped snapshots.